|
A Model Plan: How Can We Gauge the Bay's Cleanup?
Daniel Strain
Billions of dollars and the fate of the Chesapeake Bay hinge on a few computer simulations. Who are the scientists behind these "models," and how are they being used to drive the biggest effort to clean up a body of water in U.S. history?
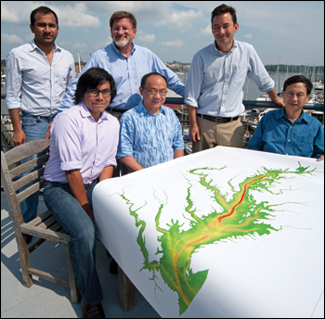
You could call them dragon-tamers, these members of the Chesapeake Bay Program's modeling team gathered around a snapshot of their simulation of the Chesapeake Bay's waters. They call this computer model, formally known as the Estuary Model, the "dragon." Pictured (from left): Gopal Bhatt, Guido Yactayo, Lewis Linker, Richard Tian, Gary Shenk, Ping Wang. Not pictured: Amanda Pruzinsky. Credit: Michael W. Fincham.
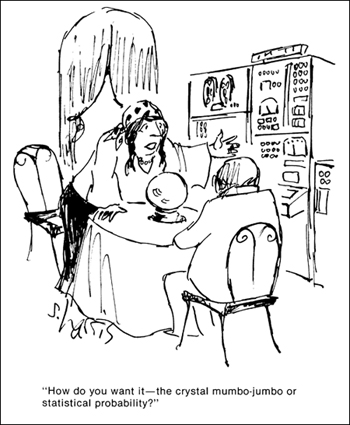
PICTURE THIS: A FORTUNE-TELLER, DRESSED IN JEWELS and a bandana, entertains a client. Between them sits a crystal ball. And in the corner, a multimillion-dollar supercomputer. "How do you want it?" the soothsayer asks. "The crystal mumbo-jumbo or statistical probability?"
That's the gist of an old cartoon by artist Sidney Harris. The joke may be tongue-in-cheek, but it gets to an ongoing debate in modern environmental science: when it comes to representing the ins-and-outs of natural ecosystems — say a river or an estuary — and predicting what they'll do, are computer models any better than a shot in the dark? Nature is, after all, almost dauntingly complex and, as any scientist will tell you, full of surprises. So the question arises, for making decisions about managing the environment, whom do you trust: the fortune-teller or the modelers?
That same question has driven much of Lewis Linker's career. This modest scientist works out of an office overlooking Spa Creek, a small waterway that meanders inland from Annapolis's harbor just off the Chesapeake. He's the modeling coordinator for the Chesapeake Bay Program, a partnership between state and federal agencies tasked with protecting the nation's largest estuary. With his colleagues in Annapolis, Linker builds computer simulations — or "models" in scientific parlance — to diagnose the Chesapeake's illnesses and investigate new cures. These models seek to represent the Bay's physics, chemistry, and biology using a series of mathematical calculations and some approximations. That's no small task.
The team's latest effort, the Phase 5.3 Watershed Model, represents an unprecedented attempt to simulate the inner workings of the entire Chesapeake Bay watershed — a 64,000-square-mile area that stretches from Virginia to the headwaters of the Susquehanna River in Cooperstown, New York. This model is at the heart of an equally ambitious effort to clean up the Chesapeake Bay, tributary by tributary. It will go like this: over the next 13 years, federal and state officials will employ a tool called the Chesapeake Bay Total Maximum Daily Load, or TMDL, to mandate major cuts to the excess nutrients and sediments streaming off the region's farms, cities, and skies. Linker's model is, in turn, setting those limits. They've been dubbed the Bay's "pollution diet."
Balancing on the deck of the R/V Kerhin, Kristen Heyer shows off a probe used to monitor water quality in the Chesapeake Bay. The Maryland Department of Natural Resources crew members lower this probe via a metal cable down into the choppy Bay, taking detailed readings of temperature, saltiness, and dissolved oxygen levels up and down the water column. Those data points are later fed into a computer model of the Bay. Credit: Daniel Strain.
This diet's vast reach and its uncertain costs (see Cleaning Up the Bay) have, perhaps not surprisingly, brought intense scrutiny to Linker's work. Most scientists today acknowledge that all models are imperfect, but they're also invaluable tools that offer new ways to learn about and, yes, even predict the future of natural environments. And here in the Chesapeake watershed, researchers are working to develop and push for new ways to make Bay modeling better — and a bit less like the prophecies of Madame Fortuna.
The results from this modeling effort are especially important to those who've spent their lives fighting to clean up the Chesapeake. This federal and state push may be the Bay's last best chance for a healthier future, says Beth McGee, senior water quality scientist at the advocacy group the Chesapeake Bay Foundation. "I don't think we'll have another chance at this in our lifetimes," she says.
Cleaning the Bay
Miles away from Linker's quiet office, Kristen Heyer feeds a bundle of cables and hoses off the side of a small research boat, now idling just north of the Virginia border. The swells are tall this morning, picking up and dropping the R/V Kerhin like a bath toy. But Heyer, a biologist with the Maryland Department of Natural Resources (DNR), doesn't seem to mind. As far she she's concerned, the waves are calm today. "This is actually pretty good for here," she says.
She would know. Heyer's been to this exact spot at the mouth of the Potomac River about once a month — and sometimes more often — for the past 15 years. She's one of a wide network of scientists across six states and the District of Columbia who collaborate with the Chesapeake Bay Program to monitor the Bay and its tributaries. Today, she and her crew are giving me a lesson in what's ailing the estuary.
Below deck, one of the DNR team suggests I take a whiff of a sample of Bay water. Now stored in an old milk jug, this particular sample had been sucked up from right above the Bay floor. I pick up the jug, unscrew the cap, and inhale deeply. The liquid smells like rotten eggs. More accurately, it smells like the hydrogen sulfide waste produced by bacteria that thrive in environments deprived of oxygen. It's the telltale odor of the Chesapeake Bay dead zone.
Chesapeake Bay TMDL Goals for 2025
|
|
| |
2025 Goal (million lbs.
per year) |
2009 Baseline (million lbs.
per year) |
%
Reduction |
|
|
| Nitrogen |
186 |
248 |
25 |
|
|
| Phosphorus |
12.5 |
16 |
22 |
|
|
| Sediment |
6454 |
7980 |
19 |
|
|
In order to meet the water quality goals set by the Chesapeake Bay TMDL, states in the watershed are required to cut the nitrogen, phosphorus, and sediment loads they deliver to the Bay. To develop baseline figures, Bay Program scientists used their Watershed Model to estimate the loads that were delivered to the estuary in 2009. The team also announced targets in 2010 — the TMDL “allocations” — that states in the watershed must address by 2025. Source: Chesapeake Bay Program.
That dead zone emerges every year as spring rains wash loose dirt and fertilizers off farms and towns across the Chesapeake watershed and into the region's major rivers — all of which eventually lead to the Bay. Those same pollutants, which are rich in basic nutrients like nitrogen and phosphorus, in turn, feed some of the estuary's tiniest residents, including algae and small crustaceans. But by the summer, this time of plenty takes its toll: as those organisms grow, then die and sink, bacteria feast on their remains and, in the process, sap the Chesapeake's oxygen supplies. That, in turn, creates wide regions of bottom-waters too low in oxygen to support much animal and plant life. In fact, between 1985 and 2011, nearly 17 percent of the waters in Maryland's portion of the Bay, on average, fit that description. They're part of the same dead zone I had smelled on board the Kerhin. Excess sediments mixed into the Bay play their part, too. They cloud the water, cutting off the sunlight that sustains aquatic plants, which produce the oxygen needed by fish and crabs.
Back in Annapolis, Linker may not be able to inhale that rotten egg smell, but he sure can model it. He and his colleagues — today, there are seven modelers at the Bay Program — draw on real-life data, including those gathered by the DNR crew, to build simulations of the Bay and its watershed over time. They've split the watershed into roughly 1,000 land segments. And so far, they've recreated past conditions on the Chesapeake from 1985 to 2005 and are making a push to extend the picture to 2011. Don't think of these models like a map — you can't find your home on them, and there are no computer avatars sailing the Choptank River. Instead, they're a string of equations meant to capture the environment's physical and biological processes, everything from how much riverbanks erode to how quickly microbes digest nitrogen molecules. "It takes a big problem and breaks it down into little tiny blocks," Linker says.
The scientist, whose short-cropped goatee has now turned gray, has seen a lot of models come and go. He joined the Bay Program in 1984, a year after the partnership began and just as scientists were begining to understand the role that nutrients and sediments play in the Bay's ills. These days, he mostly coordinates, talking to researchers and his colleagues to make sure that the program's various models incorporate the best science out there. The now-veteran modeler — who has a warm smile and a tendency to belly laugh — also spends many of his weekends on Virginia's Rappahannock River. He owns what he calls "the humblest little cabin in the world," just a place to keep a few canoes and kayaks.
The Estuary Model
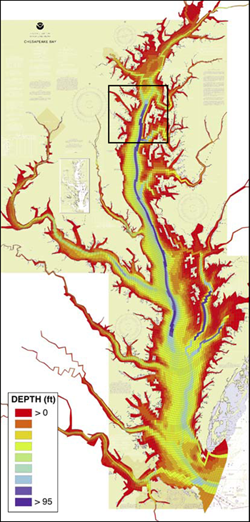
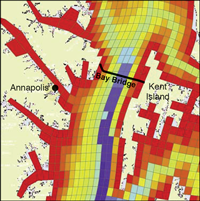
Like any dragon, the Chesapeake Bay Program's Estuary Model has scales. These scales are "cells," simulated 3-D sections of the Bay. The visualization of the model pictured here shows only the 11,000 cells sitting on the estuary's surface — nearly 46,000 other cells represent the waters below. As currents flow across the Chesapeake, the model simulates the fate of the nutrients, sediments, and algae within these small conceptual chambers. Map courtesy of the Chesapeake Bay Program.
The Evolution of the Watershed Model
As our understanding of what makes the Chesapeake Bay work the way it does has evolved, so has the Chesapeake Bay Program’s Watershed Model. Over time, its modelers have simulated more of the physics, chemistry, and biology that drive the estuary and have built in more detail, showing the Bay at smaller and smaller scales. Here is a summary of that evolution. Source: Chesapeake Bay Program.
And that serene environment is, ultimately, what Linker says he's trying to protect. When his sons, now grown men, were little, he used to tell them that he cleaned the Bay. So they assumed that when he went to work, "I would put on some sort of orange outfit," he says. "And I would go out, and I would start cleaning the Bay."
For him, models help to do just that. At their core, he says, they're tools that allow people to ask questions — such as how much of this pollution is my fault, and what can I do to help? "It doesn't matter where you are in time, early on in the Bay Program or now," he says. "Those are the questions that people ask. So you need this synthesis tool."
By synthesis, Linker means that models can offer a big-picture view of the Bay and its health as an integrated whole. Scientists can then ask the model "what if" questions — questions such as: what if we change one particular aspect of the Bay in a certain way? Over time, the modelers' "what if" questions have gotten more and more complex. Here's an example of that complexity researchers can pick one region of the watershed and, in a computer simulation, "install" more acres of streamside trees, also known as forest buffers. These trees should be able to take up some of the nutrients coming off the nearby landscape. And the model will simulate by how much, drawing from estimates that other scientists have taken of the nutrient appetites of such buffers.
Next, the modeling crew feeds that new estimate of the Bay's total pollution burden into a second model. It's dubbed the Estuary Model, but Linker calls it "the dragon" because it produces an image that looks like a snaking sea creature (see map above). The dragon essentially mimics the Chesapeake Bay's churning waters, showing what will happen to every pound of pollution that mixes in — how much will sink to the bottom and how much will be devoured on sight by algae. And on and on. In other words, do those new acres of trees help the Bay? How much cleaner might the water be when they're planted?
In the end, the point is to help state governments develop strategies for cutting their nutrient and sediment wastes. "That's where the rubber meets the road in this model," says Gary Shenk, an environmental engineer by training who oversees watershed modeling in Linker's group. "The real output of this model is the change in [nutrient and sediment] loads due to management actions."
Scientist and Maryland native Lewis Linker always makes time for the real Chesapeake Bay — he’s an experienced kayaker and likes spending time close to the water. Recently, he wrote a research paper about his modeling work while sitting on the front porch of his cabin on the Rappahannock River in Virginia. “It just felt so productive,” he says. Credit: Michael W. Fincham.
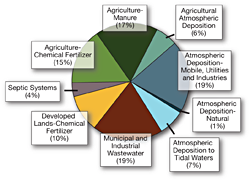
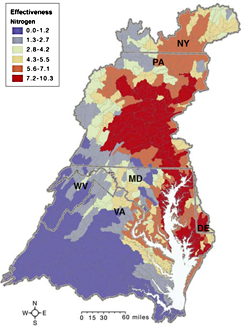
Where Does All That Nitrogen Come From?
Not all of the watershed's moving parts contribute equally to the Bay's poor water quality. Scientists at the Chesapeake Bay Program used earlier watershed and airshed model simulations (considering land use and pollution control measures in place as of 2007) to estimate where the excess nitrogen delivered to the Bay comes from (pie chart, below). While much of that nitrogen comes from the land, some of it, often in the form of nitrous oxide, comes from the atmosphere. Some regions also affect water quality in the Bay more than others, as shown on the map below. Because of how water moves in the watershed and the estuary, cuts to nitrogen loads made in some regions (shown in red) will improve water quality in the Bay by more than will equal cuts made in other areas (blue). Bay Program scientists, who created the map in 2010 using their newest watershed model, quantified this tendency on a scale termed "relative effectiveness." Source: Pie chart, National Research Council; map, Chesapeake Bay Program.
Today, that rubber is meeting the road in a big way. Based on rules laid out by the Clean Water Act, states in the watershed must ensure that their waterways meet certain requirements, working under the direction of the Environmental Protection Agency. Traces of chlorophyll — a molecule that helps many algae conduct photosynthesis — can only get so high, for instance. Dissolved oxygen supplies, on the other hand, can only dip so low. For decades, the mainstem of the Chesapeake and many of its tributaries have failed to live up to these standards, often miserably. Linker and Shenk calculated in 2010 that, to get these waters back to their legal limits, states must reduce their total deliveries of nitrogen to the estuary from 248 to 186 million pounds per year — a 25 percent cut. And they have until 2025 to put in place measures to achieve that goal.
Walter Boynton, an ecologist at the University of Maryland Center for Environmental Science (UMCES), says the goal isn't to restore the Bay to its state when John Smith landed in America four hundred years ago, when, accounts suggest, some of the Bay's shallower tributaries were so clear you could see right down to the bottom. Instead, the idea is to restore an environment in which underwater grasses can again flourish and blooms of algae will become less common. When asked if these are goals worth meeting, Boynton, one of the scientists who first illustrated the dangers of nutrient and sediment pollutants in the Bay, puts it simply: "It's very important," he says.
An effort so important, however, is bound to draw its challengers.
Different Model, Different Results
Many lawmakers and organizations, most notably the American Farm Bureau Federation, have challenged the cleanup plan on economic grounds. But one of the most potent challenges to the science behind the Phase 5.3 Watershed Model came in December 2010. That month, a Washington-based environmental consulting firm called LimnoTech published a report arguing that not all models agreed with the Bay Program's. Hired by an interest group called the Agricultural Nutrient Policy Council, LimnoTech used a simulation designed by the U.S. Department of Agriculture (USDA) to calculate completely different estimates of the Bay's pollution burden. The company reported that nitrogen wastes delivered to the Bay could be as much as 30 percent less than what Linker's team estimated.
And many took note. In March 2011, a U.S. House of Representatives subcommittee convened a hearing to discuss the cleanup plan, addressing the LimnoTech report and its findings in depth. Linker and Shenk were suddenly thrust into the spotlight.
Still, their science stood up to the attention. A group of independent scientists advising the Bay Program eventually refuted much of the LimnoTech report. For starters, they concluded that the report had exaggerated the differences between the models. Once corrected, the estimates of nitrogen pollution diverged by only about 15 percent. Panelists said that a discrepancy of that magnitude should be expected given that the models were built for different purposes and based on a different set of rules. The USDA effort, for instance, was designed to advise farmers on how to best conserve the nutrients in the soils on their individual plots, not dictate actions on a watershedwide scale.
Linker and Shenk take their critics in stride. Linker says the Bay Program's science has flourished because of just that — people pointing out what the team has done wrong. As the Watershed Model evolved over nearly 30 years, "We were able to rework and improve the model at every stage, not because we loved complexity but at the request of decision makers," Linker says. Still, he notes, "Criticism can be important, but you've got to get your facts right."
The problem ultimately comes down to models themselves. In short, models, especially those that capture complex and constantly changing natural environments, offer a portrait of reality that is incomplete — if only somewhat. "Models are never done," says Walter Boynton. Modelers simply "get them to a point where they draw a line in the sand and say, 'OK, that's good enough for now.'" No matter how many environmental processes you think you've captured, there are likely some that you've missed or couldn't measure accurately. As a result, models representing how the Bay works, and how it could be restored, carry with them some uncertainty that may be impossible to eliminate. The Bay Program hasn't measured the extent of this uncertainty in its own model.
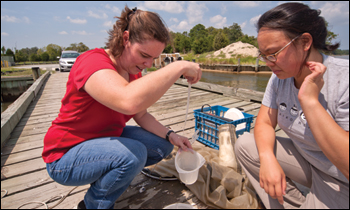
Carefully avoiding stinging tentacles, Maggie Sexton (left), a researcher working with scientist Raleigh Hood, and Jacqueline Tay, a graduate student, remove a jellyfish from a special net designed to catch floating sea life. The team, which works at the UMCES Horn Point Laboratory, comes to this spot on the Choptank River once a day to look for sea nettles, collecting data that may help improve how computer models predict where you can find jellyfish in the Bay. Credit: Daniel Strain.
Boynton says that the error is likely small, however. Linker and Shenk have tweaked and improved the model over decades, and their estimates seem to be in the ballpark. "It's good enough to go forward," he says. Kevin Sellner, who directs the Chesapeake Research Consortium, a group of research institutions, notes that Linker and Shenk's work has been reviewed by outside scientists. Their model has "gone as far as possible as far as complexity and its ability to represent reality," he says. It may be a murky crystal ball, but it's the best the Bay has.
Still, one crystal ball alone may not be enough.
A Multitude of Models
Raleigh Hood takes his small sport boat out onto the Chesapeake Bay almost every weekend. And when he does, he looks for sea nettles. Hood has the laid-back look of a man who's spent much of his life on the water and a mustache you'd expect to see on Wyatt Earp. But he's a modeler, working at the UMCES Horn Point Laboratory. In fact, he designed a computer model that forecasts how likely you are to see jellyfish at certain spots along the Bay, based mostly on how salty and warm the water is. So when he looks for jellyfish, he's not just trying to avoid getting stung. He's also seeing how right his model predictions were.
When Hood first arrived at Horn Point in the mid-1990s, however, the Bay Program was "the only game in town" when it came to modeling the Chesapeake Bay, he says. But he wasn't content to leave it at that. Hood built his own model to show how ocean currents influence the spread of floating sea creatures — one of the first independent models of the estuary. That work laid the foundation for his jellyfish forecaster. By the early 2000s, smaller simulations like this one had become commonplace. Or, as a jellyfish researcher would say, they bloomed. More scientists began using computers to ask questions about the Chesapeake ecosystem. Over a few years, modeling had turned democratic.
As far as Hood's concerned, that's a good thing. He believes the Bay Program won't solve its uncertainty problem solely by continuing to improve its Phase 5.3 Watershed Model. Instead, he says, scientists should take a new tack: embrace even more models, a whole slew of them, in fact. It's a strategy used by the Intergovernmental Panel on Climate Change, an organization convened by the United Nations. The group is well-known for publishing science-based predictions of how much the Earth will likely warm in the future. And it always gives those predictions in a range — one scenario forecasts 2 to 4.5 degrees Celsius by 2100 — based on a set of models that predict future temperatures in different ways based on different sets of calculations. Scientists then use the results from this multiplicity of models to suggest how much uncertainty lies in their forecasts of the global climate.
The Bay Program could do the same, Hood argues, considering alternative models that give different estimates of the severity of nutrient and sediment pollution in the Bay today. Many scientists agree. Kevin Sellner, who sits on a panel of independent scientists that advises the partnership, says the point isn't to pick the best model. But if multiple models agree fairly closely with each other, scientists like him and, perhaps, the broader community could feel much more comfortable with Linker and Shenk's estimates.
Or, in other words, they could confirm that the Bay Program's model describes the Bay accurately — or accurately enough to justify pressing ahead with the partnership's expensive, multi-year cleanup plan.
Shenk is certainly open to the possibility of a multiple model future: "We are cautiously interested," he says. "We think it makes a lot of sense...but there are real limits in terms of what may be possible." In the end, the Bay Program would still have to pick one estimate of the Bay's nutrient and sediment burden to set its cleanup plan goals. So which one should Shenk choose? A high-ball estimate? Or a low-ball?
That gets back to the question of the fortune-teller and the computer model. Kenneth Reckhow, a well-known modeler from Duke University, has spent a lot of time pondering that choice. In fact, during a recent talk given to a group of water managers in Chicago, he led with Harris's old cartoon. He says that for all their faults and uncertainties, models are still the best tools to address problems like the Bay cleanup. The watershed is just too big to measure every bit of nitrogen, phosphorus, and sediment that winds into the Bay. Models are a necessary shortcut. In other words, "You'd go with the computer," he says.
As members of the Bay Program do just that, both the effort's critics and its supporters will be watching closely. In fact, the success or failure of this ambitious and risky plan may decide how the United States approaches its campaigns for cleaner water for decades. So everyone's curious. "I'm curious, too," Reckhow says.
For Linker, there's a lot riding on the TMDL. He says he's still only a scientist trying to clean the Bay. Ever the optimist, Linker says he's going to follow this effort to do just that to the last. "I want to see how the story is going to end," he says. "I really do." That's one outcome he can't model.
|