When it comes to using models to predict the impact of future climate change on the Chesapeake, scientists face a two-pronged challenge. First, they must try to predict how climate warming will affect temperature and precipitation on this regional, rather than global scale. Second, they must take these predictions and apply them to ask specific questions about the Bay itself — questions such as: How much coastal land will become submerged by the end of the century? Will the estuary become more hypoxic? Will existing nutrient loads increase or decrease?
To forecast scenarios for changes in temperature and precipitation on a regional basis, scientists must refine models that were designed to make global predictions. Roughly 20 so-called "coupled general circulation models" currently operate out of 14 supercomputing centers around the world, part of the fourth major assessment by the Intergovernmental Panel on Climate Change (IPCC). These models link atmosphere, ocean, and land interactions to reconstruct climate history of the past and to project scenarios for the future. Current model runs will recreate "controls" such as the climate of pre-industrial times and the present day. They will also forecast climate scenarios under different amounts of CO2 emission in the future — such as 100-year predictions under conditions of low, middle, and high CO2 emissions.
In a report soon to be published by the Pew Center on Global Climate Change, researchers at the University of Maryland Center for Environmental Science (UMCES) compare two of these general circulation models to predict the impact of climate change for Chesapeake Bay hypoxia — a depletion of dissolved oxygen in the bottom waters that occurs each summer and can be devastating for fish, crustaceans, and mollusks.
Precipitation, river runoff, sea level, and temperature interact with each other to affect seasonal hypoxia. All of these variables will respond to climate warming. "When you think about all the things that can change with climate and how they interact with things that we are trying to manage in the Bay, there are a lot of moving parts that we have to understand," says Donald Boesch, first author of the upcoming Pew report and president of UMCES.
At the high and middle levels of the CO2 emissions scenarios used by the IPCC, the two models predict precipitation increases in the Bay region of up to 30% in some months and decreases greater than 10% in the fall by the end of the century — including more events with extreme rainfall. Both models predict temperature increases ranging from 3.5 to 6.5°C, clustered in the summer months. But the global models do a better job of predicting temperature than precipitation at the regional scale, cautions mathematical modeler and study co-author Victoria Coles.
"We know that climate change is going to happen.
Step one is to quantify the effects we might see in this region."
But even with some uncertainty surrounding the precipitation changes under climate warming scenarios, researchers can make some overall predictions related to the Bay's hypoxia. The team anticipates that increasing streamflow, increasing summertime temperatures, plus an increased depth of the Bay due to sea level rise, would reduce the exchange between warmer surface waters and cooler deeper waters (enhancing stratification). This change would spread hypoxia into shallower areas of the Bay.
Although this study is preliminary and the researchers are currently looking for funding to do a more in-depth analysis, their findings carry a clear warning message for restoration efforts. "Given the long lag times, both in terms of implementation of nutrient control strategies and in the responses of the ecosystem," they write, "it is not too early to begin assessing the implications of climate change on management objectives for hypoxia and for Chesapeake Bay restoration."
The Environmental Protection Agency's Chesapeake Bay Program has already begun to factor climate warming predictions into their modeling scenarios for the next two-year period of decision-making. The Bay Program's models are used for management purposes — primarily to track nutrient loads and to evaluate progress towards reaching water quality goals.
As part of their 2008-2010 assessment, modelers will for the first time be able to include predictions for future changes in temperature and precipitation into a set of scenarios run through the year 2030, explains Lewis Linker, coordinator of the Bay Program's modeling subcommittee. Although the model runs will not yet be able to factor in projected sea level rise or changes in the Bay's depth (bathymetry), this new climate assessment tool will allow managers to assess how climate change may interact with progress towards restoration goals.
"We know that climate change is going to happen," Linker says, "but we don't know what it will do with respect to the flow of the rivers, or with respect to [nutrient] loads. Step one is to quantify the effects we might see in this region."
When it comes to policy decisions, these model scenarios provide a base of information. "We'll be able to make all these runs," says Linker. "How they will get used will be up to the decision makers in the Bay Program."
Chesapeake Bay Models | ||||||
 Air Quality Model Depicts air deposition |  Watershed Model Depicts land use and changing best management practices (BMPs) |  Estuary Model Depicts sediment, algal | ||||
Models use mathematical representations of the real world to estimate the effects of complex and varying environmental events and conditions. The Watershed Model (above center), for example, estimates the delivery of nutrients and sediment to the Bay by simulating hydrologic and nutrient cycles, using inputs such as atmospheric nutrient deposition, precipitation, fertilizer application, and land cover or land use. As the Chesapeake Bay Program prepares to re-evaluate its current set of benchmarks for 2010 and to set new goals for 2030, new model scenarios will incorporate predictions for warming temperatures and changing precipitation patterns. | ||||||
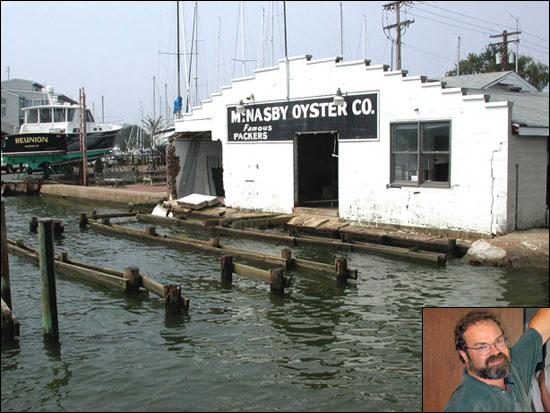
When Jeff Holland closed the doors to head home for the night, he thought that he'd done all he could to secure the Annapolis Maritime Museum against the approach of Hurricane Isabel. The museum director and his staff had moved all of the museum's artifacts and records upstairs, securing them on the second floor under a tarp. They placed furnishings and big items, like a large-scale model of the Thomas Point lighthouse, up on sawhorses, expecting high water to come and go. On the museum dock, Holland flipped all the picnic tables face down, diligently drilling and bolting them into the wood surface. If the tide topped the dock, floating picnic tables might hurt someone.
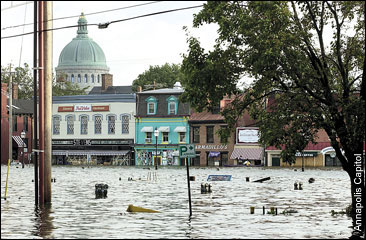
But the picnic tables did not float away. When Holland located them the next day, the tables were still well secured, still bolted. What he had a hard time finding was the dock itself. He never suspected that Isabel's nearly 8-foot storm surge, piled on top of the normal high tide, would lift the entire dock, smash it into the building, and drop it at the end of the street.
When Hurricane Isabel slammed the Mid-Atlantic region as a Category-2 storm on September 18, 2003, the impact of the storm caught everyone — even many experts — by surprise. With its eye located just south of the Chesapeake Bay, the storm took 23 lives and brought widespread flooding that damaged buildings and washed away homes. What made Isabel so destructive? Should we expect to see more such storms in the future? If so, could a warming climate be to blame?
Surge of Rising Seas
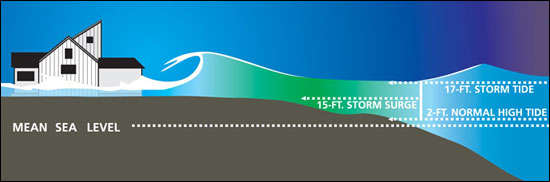
Wind and waves gave Isabel its hefty punch. During a hurricane, low pressure and high winds create a large dome of water — a storm surge. Topped by wind-whipped waves, this giant dome, often 50 to 100 miles wide, combines with the normal tide, producing what is known as a storm tide. If the surge reaches the coastline at high tide, as it did in Annapolis during Isabel, the water can top an average high tide by many feet. "And it only takes a 1-meter wave to knock down an average house wall," says Rick Murnane, a program manager for the Risk Prediction Initiative (RPI) — a science-business partnership based at the Bermuda Biological Station for Research.
The risk posed by storm surges is further exacerbated by rising sea levels, a global problem that is tied to the warming of Earth's climate. Higher sea levels encourage the formation of larger waves that break close to shore. Because the Bay is so shallow, just 1 foot of sea level rise causes a big increase in waves, explains geographer Michael Kearney at the University of Maryland College Park. In addition, sea level is rising at a rate nearly twice the global average in the Bay region, 3.5 millimeters per year. This extra inundation results from the fact that land in this region is simultaneously sinking (see Footprints of Global Warming).
A warming atmosphere, due in part to greenhouse gas emissions, will continue to raise ocean temperatures, causing the surface of the ocean to expand, explains paleoclimatologist Thomas Cronin, at the U.S. Geological Survey in Reston, Virginia. This expansion serves as a major contributor to global sea level rise, he says. But the melting of the great ice sheets in Greenland and Antarctica, along with the world's glaciers, may also play a huge role, a factor that has become "scarily apparent" in the past three to four years, says Cronin.
Picture an ice cube sitting on the edge of your bathtub, Cronin says. When that ice melts and flows into the bathtub, it will raise its level. This is what will happen as the ice sheets melt because they sit on land, not water. If the Greenland ice sheet were to melt, for example, it could cause an additional 6 to 7 meters of sea level rise globally, says Cronin.
Even in the absence of storms, global sea level rise, sped locally by the Bay's sinking shores, has already affected the Chesapeake. The Bay has lost many islands and marshlands to this combination of sea level rise and subsidence and stands to lose more still. Court Stevenson, an ecologist at the UMCES Horn Point Laboratory who works to preserve marshland, advocates physically rebuilding areas by relocating sediment to counteract the forces that threaten to destroy this critical habitat for crabs and juvenile fish.
Unfortunately, says Stevenson, we are "applying band-aids to stop hemorrhaging." The real changes need to be made in reducing carbon dioxide emissions, he says, but if "we do nothing at all we stand to lose a tremendous resource."
Another part of the problem stems from the high growth rate in the Chesapeake region. A 2005 report from the National Oceanic and Atmospheric Administration ranked the Chesapeake Bay watershed as the second most populated coastal watershed in the country and Maryland and Virginia as "hot spots" of growth. Growth puts pressure on sensitive coastal areas and, as Kearney points out, there is no real plan to account for sea level rise in planning for development.
According to Brent Yarnal, "In every place we've looked, infrastructure tends to be clustered in very vulnerable areas." A geographer at Penn State University, Yarnal worked with the Bayside community of Hampton Roads, Virginia on this overlooked intersection of storm surges, sea level rise, and coastal development. He used a model called SLOSH (Sea, Lake, and Overland Surges from Hurricanes) to evaluate how rising sea levels could increase the reach of storm surges into 16 counties in Hampton Roads and the surrounding area. The model allowed him to explore different scenarios — like the impact of a hurricane if sea level were to rise by 1 foot versus 3 feet and the effect of population growth in the region.
Yarnal then used census data, such as age and poverty, and information about the placement of critical infrastructure, such as water and sewer, to construct a "social vulnerability index" for the community. He's now working with local planners to incorporate projections for worsening storm surges into plans for future development. "When it comes time to replace that infrastructure," he says, "all planners really have to do is think about moving out of the risk zone and building it in fairly secure places. Higher ground."
Stronger Storms in Store?
The climate connection between rising sea levels and worsening storm surge may just be the tip of the (melting) iceberg. Over the past two years, a flurry of scientific papers has also established a link between warming global climates and the intensity of tropical storms.
Since 1970, the number of Category 4 and 5 hurricanes has increased by 80 percent, with the most dramatic increase occurring in the past ten years. According to a paper published in Science in September 2005 by meteorologist Peter Webster from the Georgia Institute of Technology in Atlanta, this increase in hurricane intensity correlates with rising sea surface temperatures worldwide.
In a complementary study, meteorologist Kerry Emanuel from the Massachusetts Institute of Technology evaluated the intensity of a storm relative to its duration, calculating a measure known as the "power dissipation index." Publishing these results in an August 2005 issue of Nature, he found that this index — and therefore storm intensity — has increased dramatically since the 1970s. He also found that this increase correlates with global warming trends. Emanuel's results suggest that continued warming would further increase the destructive potential of storms that, especially given growing coastal populations, could make hurricane-related losses even worse.
Is it possible that warming ocean temperatures and intensifying storms are part of a natural cycle of increased activity rather than the result of human influence? Not likely according to a collaborative study published earlier this year (September 2006) by Benjamin Santer and others in a Proceedings of the National Academy of Sciences. This study found that human-caused greenhouse gases are the main driver of the 20th century changes in sea surface temperatures now linked to intensifying storms.
Scientific evidence points convincingly to the possibility of stronger storms as the 21st century unfolds. For the Chesapeake region, rapidly rising sea levels make the specter of such storms, and the storm surges they may bring, even more threatening to coastal communities.
Confronting the future with eyes wide open, by incorporating predictions for climate warming and sea level rise into model projections and community planning, seems the best defense against a potentially tempestuous future.